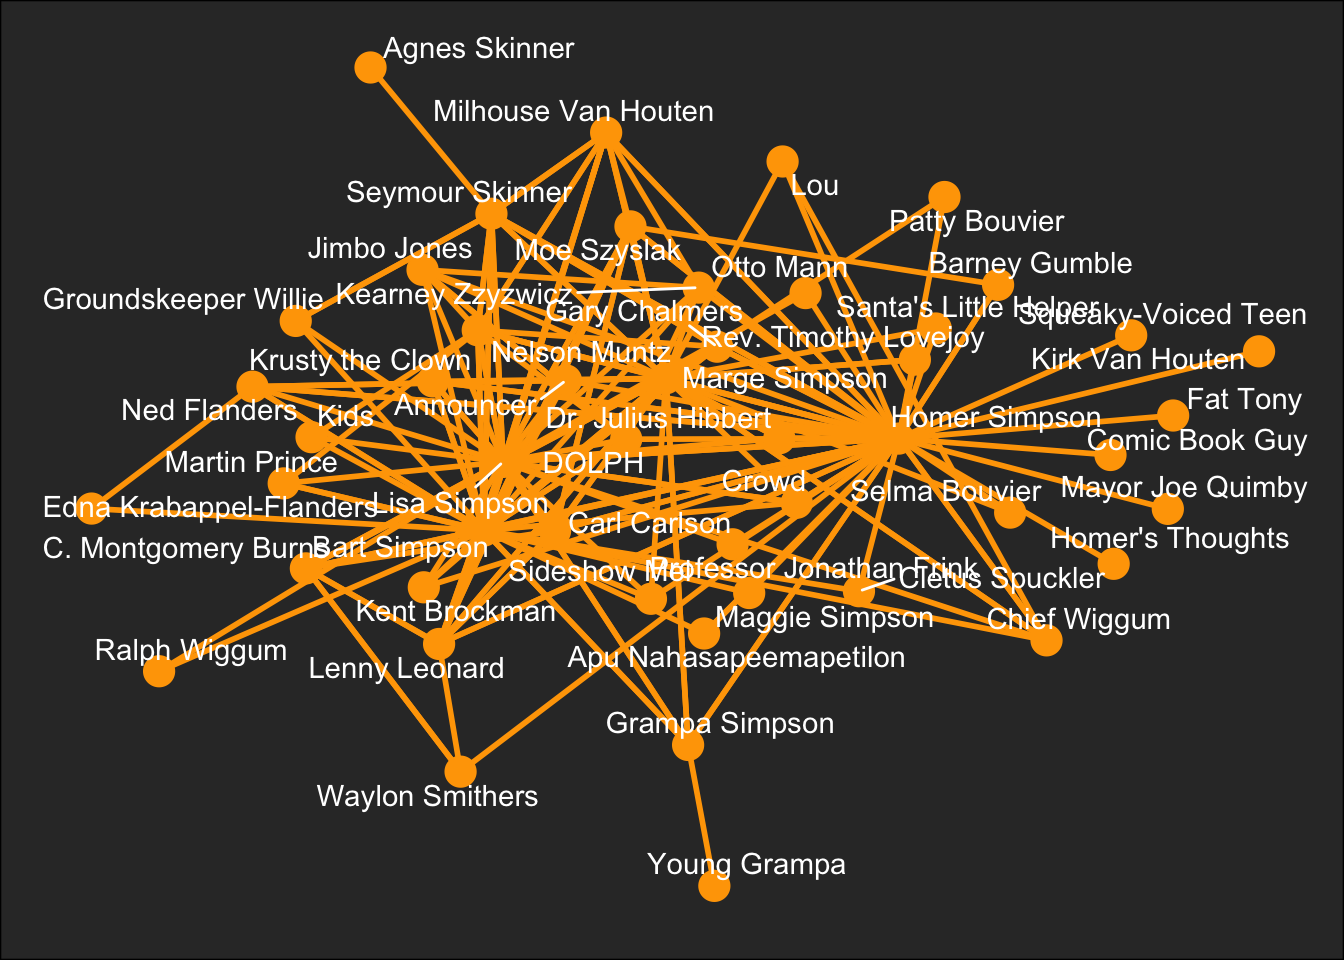
simpsons_graph <- character_cooc_net |> filter(weight > 10) |>
    graph_from_data_frame(directed = F)

simpsons_graph|>
        ggraph(layout = "stress") +
        geom_edge_link(width = 1, colour = "orange") +
        geom_node_point(size = 5, colour = "orange") +
        geom_node_text(aes(label = name), repel = TRUE, colour = "white") +
        theme_tt() +
        theme(axis.line=element_blank(),
              axis.text.x=element_blank(),
              axis.text.y=element_blank(),
              axis.ticks=element_blank(),
              axis.title.x=element_blank(),
              axis.title.y=element_blank(),
              legend.position="none")
# https://github.com/datastorm-open/visNetwork/issues/65#issuecomment-414654329

degree_value <- degree(simpsons_graph)

img_path <- "https://paulusm-research-images.s3.eu-west-1.amazonaws.com/simpsons/"
V(simpsons_graph)$shape <- "image"
V(simpsons_graph)$value <- degree_value[match(V(simpsons_graph)$name, names(degree_value))]
V(simpsons_graph)$image <- paste0(img_path, str_replace(str_to_lower(V(simpsons_graph)$name), " ", "_"), ".png")
E(simpsons_graph)$value  <- E(simpsons_graph)$weight

# Good layouts: layout_on_sphere, layout_with_kk, layout_with_dh
    visIgraph(simpsons_graph,
              idToLabel = TRUE,
              layout = "layout_on_sphere",
              physics = FALSE,
              smooth = FALSE,
              type = "full",
              randomSeed = NULL,
              layoutMatrix = NULL
      ) |>
        visNodes(size = 12, font = list(color="gray")) |>
        visEdges(color = "orange", width = 0.5) |>
        visOptions(width="100%",highlightNearest = list(enabled = TRUE, degree = 1, hover = TRUE, labelOnly = FALSE)) |>
        visInteraction(navigationButtons = TRUE, zoomView = TRUE) |>
        visPhysics(stabilization = TRUE)